

How to dig into your Google search data outside of the search console
Google Search Console UI limits your ranked queries at 1000.
If your website ranks for more than that, Google API is the only way for you to get a dataset that isn’t cut off at the ceiling, preventing you from seeing the important changes in ranks you need to see.
BTW - Even if your site is smaller than that, the API is still better. Excel is a better tool for working with that type of data.
There is a FREE Google Sheets add-on for Google API
NOTE: The comments on the add-on page say it does not work. It does work, but there are a couple of glitches in the Google API.
- The add-on only works in Google Chrome.
- It might not work if you are logged into multiple Google accounts.
- It might not work if you are not logged into a Google account as a Chrome user, or if you are using Sheets from a different Google account.
The Google Sheets add-on is known as Search Analytics for Sheets. The data you get is perfectly fine, you just need to do some digging to get it.
Workflow for Search Analytics for Sheets
1. Make a new Google spreadsheet with the add-on
Do that from a Google account that has full access to the domain you want to audit.
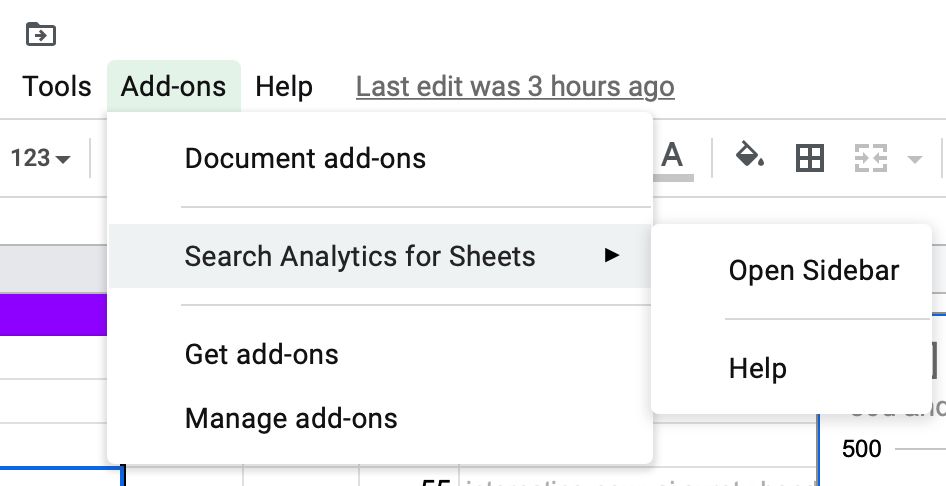
Your add-on will be available from a side bar, like so:
2. Create a second sheet for your 30-day data
Make a new sheet in your spreadsheet that you will use to dump your 30-day data for a specific domain.
Let’s say we have a domain that internally goes by the ID ‘alp’. We’ll make a sheet called ‘alp last 30’, and this is where we’ll point our 30-day data for ‘alp’ whenever we’ll pulling them from the API.
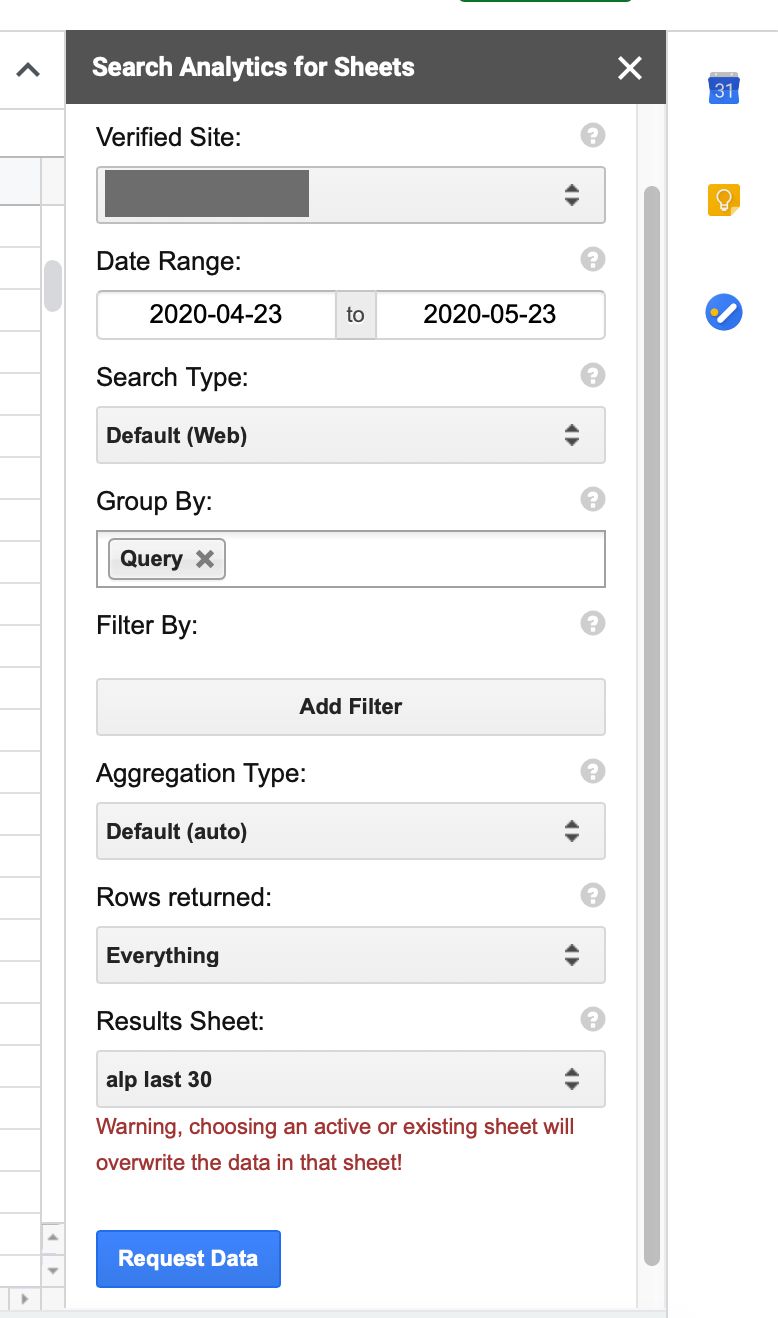
Which is done like this: Select the domain, pick last 30 days’ data range (I picked last month which is not always 30 days, I know I know), have it grouped into rows by query and point it into your 30-day sheet.
Like so:
3. Export and count your ranked queries
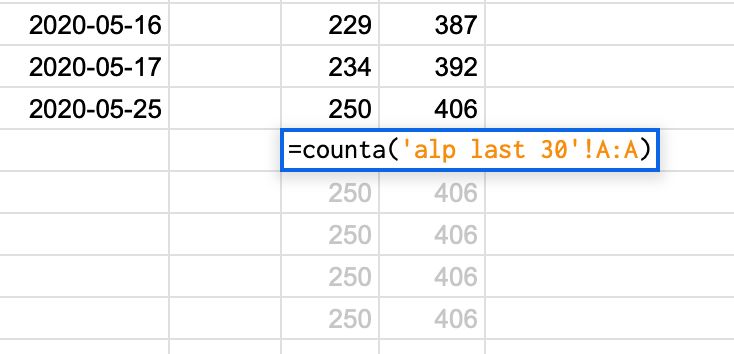
The only thing you need to do now to get the number of ranked queries over your 30-day period is to count all non-empty rows in ‘alp last 30’.
The best way to do that is from your first sheet, where you’ll have a date in column A and the count in column B:
4. Repeat to get rolling data!
To get the idea of how the number of your ranked queries changed, you’ll need to go back in time and pull rolling data for over a few weeks back.
In my POC, I dragged the right column formula over all the way down. Each time I was pulling new data set, I’d overwrite the current keyword count cell with the plain value so that it wouldn’t get overwritten with future data pulls.
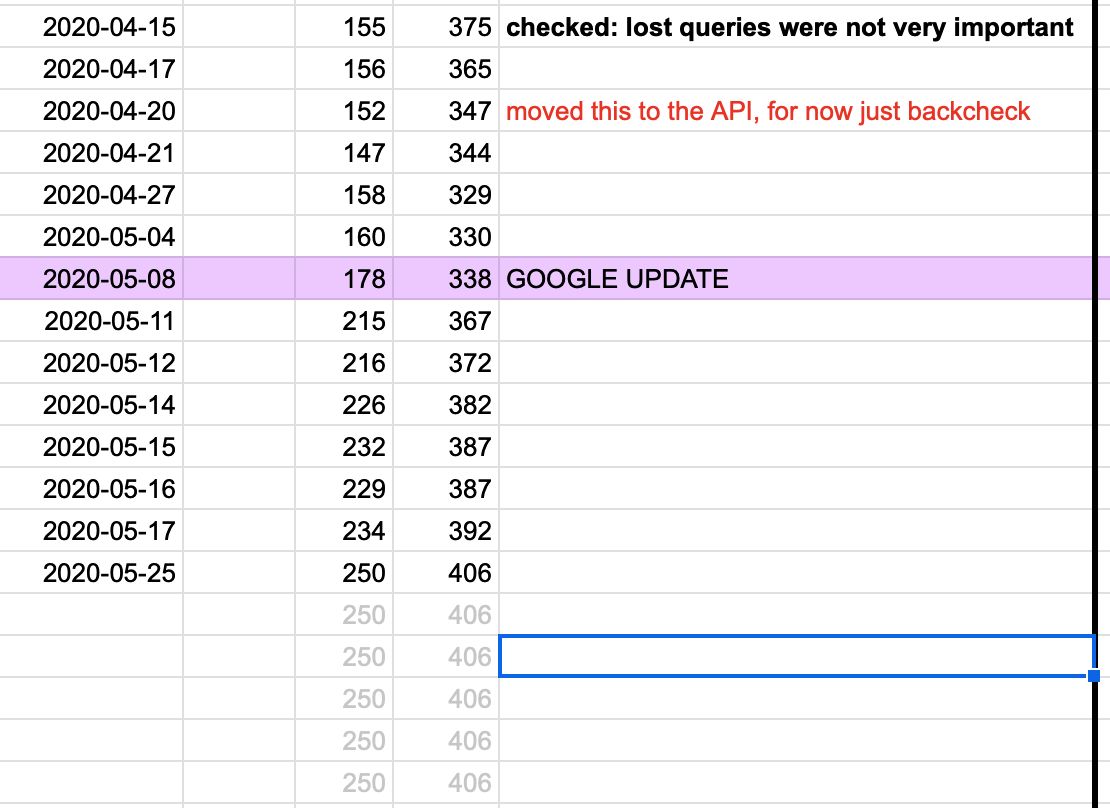
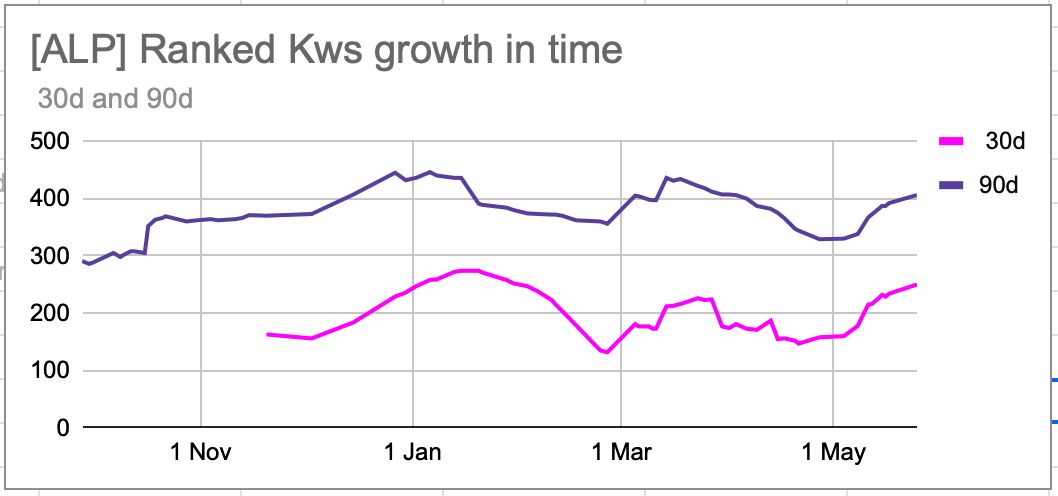
This way you can just plug these two columns into a chart which will refresh every time you fill in a new date in your A-column.
! Remember that you are overwriting your query data every time.